Exploring
the ARNAV Multi Function Display Engine Monitoring System
Background
and Summary
This article
provides an overview of an engine-monitoring system and other enhancements that
will soon be available for new (by STC) and existing (by Form 337) Cirrus airplanes.
The changes involve the addition of new hardware and software to the factory
installed ARNAV ICDS 2000 Multi Function Display (MFD) system. N365DP, Cirrus
SR20 line number 1062, has been used to test the installation and explore refinements
to the displays. The airplane, owned by Delta Papa Ltd., is leased back to and
based at Wings Aloft flying club in Seattle, WA at Boeing Field. Delmar Fadden
and Peter Morton, retired Boeing engineers and principals of Delta Papa Ltd.
worked with ARNAV on the evaluation and refinement of the engine monitor indications.
Wings Aloft
has five Cirrus SR20’s available for rental now and a rapidly growing pool of
SR20 pilots. N365DP gets plenty of exposure to pilots of varying familiarity
with the Cirrus including members who are receiving initial instruction on the
airplane.
In March
of 2001, ARNAV installed a Data Acquisition Unit (DAU) Engine Monitor Computer
for the ICDS 2000 in N365DP along with engineering software for the Engine Monitoring
Display. Individual cylinder EGT and CHT sensors were added to the engine to
support the new displays; the Cirrus installed EGT/CHT sensors and displays
are unchanged. The airplane was operated over a month with this software load.
In early May, an updated software load was installed and the outside air temperature
sensor location modified as ARNAV approached the pre-production configuration
for engine monitoring. This version of software includes engine-monitoring windows
overlaying the map in addition to the full-page engine data display.
Engine
Monitoring Experience
|
The
first instance in which we experienced an economic/safety benefit from
the Engine Monitoring Displays took place with the pre-production engineering
software load on Friday May 11th. Our plan was to prepare N365DP
for a flight to San Diego to support Sandel in the acquisition of the
3308 EHSI Supplemental Type Certificate. Wings Aloft had just completed
the 300-hour check on the airplane. We were on our way to Puyallup to
have the updated software installed by ARNAV. We expected to exercise
the software thoroughly on the trip to San Diego the following week and
give feedback to ARNAV so the system would provide maximum utility for
Cirrus owners.
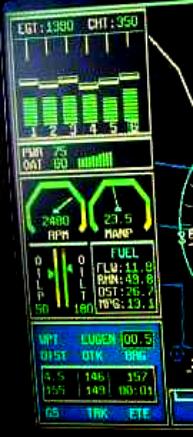
During
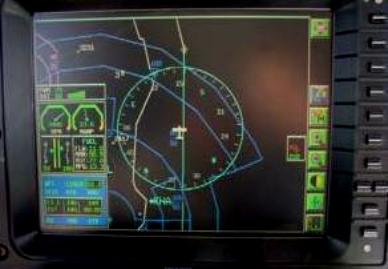
the pre-takeoff procedure at Boeing Field, we performed the magneto check
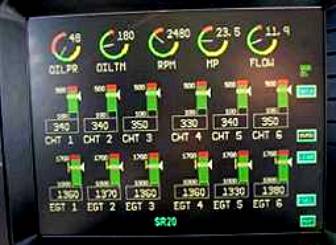
with the full page engine monitor displayed on the MFD (Figure 1).
We
were surprised to see a 150-rpm drop and feel unusual roughness from the
Continental engine on the right magneto. We repeated the mag check, and
Del pointed to the #4 cylinder EGT display; it was rapidly decaying toward
the bottom of the scale. We taxied back to Wings Aloft and reported our
findings; sure enough the #4 cylinder bottom spark plug was fouled with
a bit of oil soaked carbon and would not fire on the ground tester. Within
15 minutes the plug was cleaned and we were on our way; a major reduction
over the time it would have taken to trouble shoot all six of the right
mag spark plugs!
|
 |
|
Figure
1. Full Page Engine Monitor Display
|
Arriving
at Puyallup (all new comers to the Pacific Northwest have to pass a pronunciation
test of that word before they are given a residence visa!), ARNAV gave us a
thorough briefing and installed the pre-production software for the engine monitoring
system. Del flew a test flight to explore the new features with the ARNAV staff,
and we brought N365DP home for a good wash job in preparation for the San Diego
Trip. ARNAV refers to the system as “EngineView”.
Flashback
on Engine Monitoring Development
 |
The
previous two months had been devoted to intensive development by ARNAV
to get the engine monitor system ready for production release. The purpose
of the first trip to Puyallup in early March was to install the Data Acquisition
Unit (DAU) engine monitor computer under the instrument panel on the co-pilot’s
side, and install an additional outside air temperature sensor that would
allow the computer to calculate a “% power” indication.
The
soft key text labels on the right side of the map screen (Figure 2) were
changed to icons in preparation for the installation of the engine display
control logic. The icons select, top to bottom respectively, Airports,
Stormscope, Menus, Map scale +/-, Screen Brightness, Checklists, and MAP
.
The
full-page engine parameters display (Figure 1), which is the “power up”
mode of the system, received a thorough work out during the next several
weeks of normal operation at Wings Aloft. The initial location of the
air temperature sensor in the right engine inlet area was found to be
unsatisfactory because it picked up too much engine heat.
By
the end of April, ARNAV and Cirrus had worked out a new temperature sensor
installation on the right side of the fuselage opposite the production
OAT sensor. The next software release included our first look at a % power
indication and featured selectable windows for the engine data. The windows
allow engine data to overlay a portion of the map on the left side of
the display screen. Now we could see both map data and engine data on
the same display, a great convenience in operating the engine and airplane.
(Figures 4, 5, 6, 7 & 8)
One
week of operation with this installation raised questions about engine
leaning and resulted in more detailed discussions with ARNAV. As initially
configured the windowed EGT display on the MAP page did not have the sensitivity
needed to perform engine leaning. This meant having to switch to the
full-page engine display to lean. While this would not be an excessive
burden on the pilot, ARNAV wanted to do more to facilitate leaning, and
set out to develop a method to allow leaning from the combined display.
|
|
Figure 2. MFD Icons
|
On Friday
May 11th, the pre production configuration was ready for installation
and test. Our test flight with the ARNAV team showed that all features of the
engine monitor were operational. There were a few minor display artifacts and
system noise that ARNAV wanted to refine and filter before the final production
release, but none would interfere with our flight to San Diego.
Overview
of New MFD Operation
 |
 At
completion of the power up sequence after AVIONICS is turned on; the MFD
shows the full-page engine display, see Figure 1 above. At
completion of the power up sequence after AVIONICS is turned on; the MFD
shows the full-page engine display, see Figure 1 above.
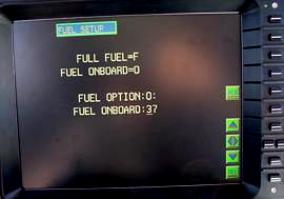
The
pilot selects the FUEL page and specifies a full or partial initial fuel
load for calculation of fuel remaining based on integrating fuel flow
throughout the trip. The “ACK” (acknowledge) icon inputs the fuel load
and the MFD reverts to the Figure 1 configuration.
|
|
Figure 3. Fuel
Quantity Input Screen
|
Map
Display Sequence
Selecting
the lower right MAP icon (Figure 1) provides the first of three MAP displays
(Figure 4), similar to the original delivered Cirrus configuration. The following
series of photos in Figures 5 and 6 taken during the flight leg from Boeing
Field to San Diego via Napa, CA show displays available by repeatedly selecting
the MAP icon.
Map
and Navigation Data Window
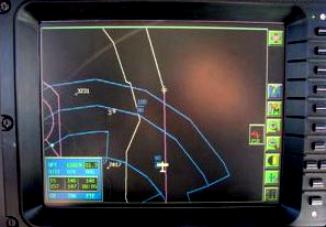 |
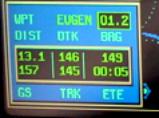
The
navigation data window has been moved to the lower left corner of the
map display to maximize the available look-ahead map area and to provide
room for the engine monitoring windows.
A
new data element to the right of the active waypoint caption in the navigation
data window shows the calculated fuel necessary to reach the active waypoint.
|
| Figure
4. MAP with Basic Navigation Data Window |
Display
Options: Full Compass Rose and Relocation of Obstacle Data Display
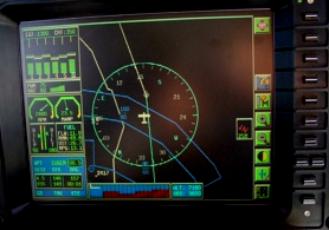
As shown
in Figures 5 & 6, a new display option accessible from the MENU and Display
Options selection provides a full compass rose around the airplane position
when operating in track up orientation. We find this feature particularly useful
for VFR operations in the vicinity of airports. Also, (see Figure 6) the Display
Options selectable Obstacle Data display has been relocated under the airplane
symbol to provide maximum area for navigation look ahead.
Basic
Engine Data
 |
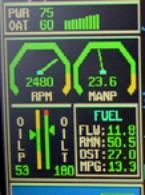 A
second press of the map button adds the basic engine data window above
the navigation data. A
second press of the map button adds the basic engine data window above
the navigation data.
|
| Figure
5. MAP with Basic Engine Data Window |
The Basic
Engine Data Window shows:
- PWR
& OAT, % of power based on the new outside air temperature sensor
and altitude.
- RPM,
manifold pressure, oil pressure andtemperature, all use existing
Cirrus sensors.
- Fuel
panel indicates:
- FLW,
Fuel flow, using original Cirrus fuel flow sensor.
- RMN,
Fuel remaining = fuel used (Flow x Time) subtracted from initial set fuel
load.
- DST,
Fuel to destination based on current ground speed and fuel flow. Subtracting
DST from RMN provides a continuously updated value of destination
fuel aboard.
- MPG,
Nautical ground miles per gallon; ground speed divided by fuel flow. A continuous
indication of instantaneous flight efficiency.
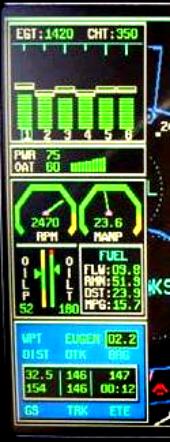
Expanded
Engine Data Window
 |
A
third press of the MAP button adds an EGT / CHT window above the basic engine
data window. (See figures 7 & 8) Six green thermometer indications portray
the EGT for each cylinder. Six white bars show the corresponding CHT for
each cylinder. At the top of the window digital values show the highest
of the six cylinder EGT and CHT values. A blue box around the cylinder
number at the bottom of the window indicates which cylinder is associated
with the highest value. The narrow bars projecting downward from the top
of the window show the reduction in current EGT from peak EGT since reset
on the Figure 1 display, and are an aid for use during leaning. The leaning
procedure that uses these bars is described below. |
| Figure
6. MAP with Expanded EGT/CHT Window |
Leaning
The Engine to Best Economy and Best Power
 |
 |
| Figure
7. Engine Monitor Windows Set for Best Economy |
Figure
8. Engine Monitor Windows Set for
Best Power
|
The engine
monitoring system responds to any decrease in cylinder EGT by generating
a narrow vertical bar that extends down from the top of the EGT display on the
Engine Monitoring full-page display and also in the expanded EGT/CHT window
of the combined display. Until the EGT reduction exceeds 50 degrees below peak,
the bar is blue. Beyond that value the bar turns yellow. The first cylinder
to peak causes the cylinder designation box to freeze and the digital value
to follow that cylinder only.
Leaning
Procedure
- Reset
the LEAN function on the full page Engine Monitor display (Figure 1) to cancel
any fluctuations in EGT that occur during takeoff and climb.
- Lean
with reference to the Figure 1 page or the Figure 7&8 Expanded EGT / CHT
window of the Map selection.
- Move
the Mixture control toward Lean. The Engine Monitor checks the EGT value for
each cylinder to determine when the peak for that cylinder is reached. After
the peak temperature is reached, a small vertical bar above the related EGT
begins to descend.
- For best
economy, continue to lean and observe the vertical EGT bars. When the first
cylinder reaches peak minus 50 degrees (see POH page 4-14) the related bar
turns from blue to yellow. Move the Mixture control toward Rich until the
bar returns to blue. Precision leaning for best economy is thus easy to achieve.
- For best
power, lean the mixture until the first blue bar appears, and then richen
the mixture until the first bar turns yellow. Richen an additional 25 degrees
by reference to the digital display. We have suggested and ARNAV has agreed
to add a tick mark at 75 degrees (see POH page 4-14) to the bar in order to
facilitate this function.
Map
Display Selection Summary
A
fourth press of the MAP button selects the full-page engine data display shown
in figure 1. In addition to the larger graphics this display provides a digital
indication for each engine EGT and CHT display.
The next
press of the MAP button starts the cycle again through the Map Navigation and
Engine Monitoring Window series.
Stormscope
Operation
When the
optional Stormscope (WX-500) is installed the related icon incorporates a small
square that appears as a red and white checkerboard if the Stormscope has detected
a strike whether or not the Stormscope display is turned on. This is a particularly
nice feature when operating at map ranges lower than the minimum Stormscope
display range of 25 miles in the terminal area.
Engine
Data Pop Up
The Engine
Monitoring System will detect when any of the engine parameters are out of specified
limits. If this occurs when operating in the Basic Map mode the MFD will switch
to the full-page engine display giving the pilot the chance to make any needed
decisions with all available data. A selection on the engine display page allows
the pilot to override this feature if automatic switching is not desired.
%
Power Calculation
The Data
Acquisition Unit (DAU) computer calculates % power based on an algorithm derived
from the POH data and the temperature deviation from standard sensed by the
new outside air temperature sensor. This calculation, when performed by the
pilot using the POH, is a many step operation and, at best, yields approximate
manifold pressure and rpm settings. Having the % Power available instantaneously
during cruise, as well as during interrupted climbs and descents (especially
under ATC control in IFR) is a great convenience and should result in more precise
operation of the engine and greater opportunity to scan for outside traffic.
We have suggested some minor changes to the % power window format, which ARNAV
will incorporate in the production release. The POH charts and the algorithm
that calculates the % power indication is based on the engine leaned for Best
Power (see page 5-25 of the POH). Leaning does affect actual delivered horsepower,
and we see that effect in the reduction in true airspeed at the lower fuel flow
corresponding to Best Economy. Neither the POH nor the % power indication reflects
the change in horsepower that occurs with mixture variation.
Data
Recording
An electronic
“snapshot” of all the data monitored by the Engine Monitoring System as well
as the GPS data obtained from the Garmin 430 is recorded once every minute on
a data card installed in the MFD. This data can be downloaded to a PC through
an installed RS232 data port under the co-pilot’s panel or the data storage
card can be returned to ARNAV for readout and analysis. Either way Cirrus owners
have a new way of monitoring the performance and indication trends of their
engine and their airplane. As we experiment with this capability we will pass
along our findings.
Engine
Economics
It is interesting
to speculate on the economic improvement potential in cost of ownership provided
by the Engine Monitoring system. Here are some ideas we think about:
- Best
Economy compared to Best Power provides substantial reductions in fuel flow,
as shown in Figures 7 and 8. Prior to installation of the Engine Monitor,
we were reluctant to lean to Best Economy because only one cylinder is monitored
by the Cirrus production installation, and that cylinder might not be the
first one reach peak EGT when leaning. In fact, before installation of the
engine monitor on N365DP, we would get engine knock and roughness before reaching
50 degree lean of peak; a clear indication that one of the unmonitored cylinders
was operating too lean. Now we can operate at Best Economy with precision
and confidence.
- There
is a reduction in true airspeed experienced when operating at the lower fuel
flows associated with Best Economy; usually more than the one-knot difference
shown in Figures 7 and 8. In our experience so far, it seems like a 20% reduction
in fuel flow was achieved by leaning to Best Economy, which caused about a
5 to 7% reduction in true airspeed; still a substantial net gain in miles
per gallon. The change in delivered horsepower from leaning to best economy
is not reflected in the POH charts or in the % power indication.
- The range
and endurance of the airplane and the corresponding need for fuel stops is
enhanced by the ability to operate lean of peak. On our leg from Boeing Field
to Napa, CA we operated at Best Economy except for the brief time needed to
take the photo in Figure 8. Under the conditions of that day, we encountered
strong headwinds, and would have made a fuel stop rather than flown the 5
plus hour leg with IFR reserves at the higher fuel consumption associated
with Best Power.
- Data
recording may have substantial long-term impact on engine maintenance costs
and the opportunity to detect engine deterioration before it has an effect
on engine condition. This may have particular potential if ARNAV is able to
provide owners with comparisons to fleet data upon analysis of fleet data
cards.
Fuel
Remaining Considerations
Fuel quantity
and fuel remaining indications are commonly used on large aircraft to provide
a backup in case of a sensor failure since the two systems use completely different
sensors and are based on different calculations. The differences greatly improve
the backup value of the combined system. At the same time inaccuracies and
tolerances in both systems can combine to cause a visible disparity of a few
gallons during flight.
When we
flew four and five-hour legs after selecting full fuel in the selection page
(see figure 3) we consistently arrived with more fuel indicated on the tank
gages than calculated by the system on the fuel remaining display. The discrepancy
ranged from three to five gallons. Since the fuel gages are intended to have
maximum accuracy and readability in level flight near the empty state, it is
reasonable to assume they are the more reliable indication of actual fuel remaining
when the quantity is low. (We did not perform any tests to confirm this by running
a tank dry.)
The primary
variables affecting the fuel remaining calculation are the total fuel loaded
in the tanks and the calibration of the fuel flow sensor. The primary variables
affecting the fuel quantity indication are the actual capacity and shape of
the tank and the attitude of the aircraft. Fuel density effects may not match
exactly but should be in the same direction for both systems.
There is
no precise indication in the tank that shows when it is full. The tab provides
a calibration point for partial fueling but full is left to the discretion of
the fueler and the pilot. We suspect that fueling differences can be as much
as 1 to 3 gallons per tank. Our conclusion is that N365DP with tanks filled
to the base of the filler neck holds 60 to 62 usable gallons. It may be that
we are fueling into the tank expansion space, or the tanks on our airplane are
slightly larger than specified. The result is conservative and tends to increase
the range of the airplane at the expense of slightly higher fuel aboard at takeoff.
Summary
The capabilities
of the ARNAV MFD Engine Monitoring system are truly impressive and will make
engine operation easier for power setting, leaning, monitoring and fuel management.
The display window locations keep the pilots’ eyes close to the glare shield
where frequent traffic scans are possible during engine operation, system checks,
leaning and monitoring. The % Power indication is a great aid to rapid power
setting compared to the attention needed to refer to instruments on the far
right hand instrument panel and a POH in the pilot’s lap. Leaning the engine
by reference to the new vertical indicators is more rapid and precise than using
the single EGT gage on the far right of the instrument panel. Thus, he system
produces an ability to keep an eye outside the airplane more of the time; an
aid to the “see and be seen” method of traffic surveillance. Overall, we really
value the reduction in workload and paperwork distractions provided by the engine
monitoring displays.
The photos
in this article reflect a pre-production version of the Data Acquisition Unit
software. ARNAV will be updating their web site to reflect the production and
retrofit configuration of the displays. The system is listed as “EngineView”
on their web site. We understand that some of the enhancements not connected
to engine monitoring are available as a separate upgrade to the ICDS 1000 installation
on the Cirrus.
Next steps
for new factory airplane installation of the Engine Monitor involve ARNAV acquiring
a Supplemental Type Certificate for the system, for which N365DP will be made
available. Retrofit of existing airplanes can be accomplished through a FAA
Form 337 Field Approval process.
Peter
Morton and Delmar Fadden